

It’s not enough, these days, to have a great-looking website with great functionality and brilliant content. It needs to be fast. Very, very fast, actually. This is essential for usability and to potentially boost your SEO ranking and ensure that once visitors land on your pages, the content is instantly displayed, as they expect, meaning that they will stay on your site longer, and engagement. Otherwise, there is a high risk of them leaving your site and ending up on your competitors’ sites. Therefore, you may want to know how to improve page speed, and the following will explain the technical approach to this and achieve a better user experience.
But how do you know if your website is fast enough? Well, you can simply visit your home page and reload it, and time how long it takes to display something meaningful. However, to get a true idea of a website’s performance, proper speed measurement needs a more systematic approach, using more sophisticated tools and here’s how to do that. As a leading web design agency in London, we know that performance is just as important as aesthetics. Here is how to measure and improve your site speed for the modern web.
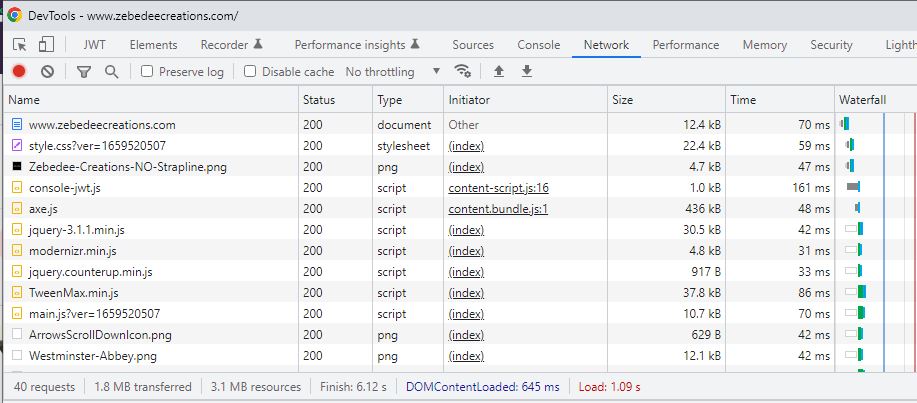
Start by taking a look under the hood, by pressing F12 or right-clicking on any empty space on your page and selecting “Inspect”. This will activate a window with a lot of code and technical info that might be a bit scary if you haven’t seen it before, but among its hidden treasures there is an essential section called “network”:
This will show all the resources that the browser will load when someone visits your page: HTML (document), images, scripts, styles, and fonts. All of these add up and the way they are loaded makes all the difference in how fast the page is and, more importantly, how the page speed is perceived. Perception is all
At the bottom of the screen, the network report will show the size of all the resources being loaded and how long they take to load. However, in the modern age of complex websites with lots of content, interactivity and rich media, it pays off to look closely at the three figures reported for loading time:
- “DOMContentLoaded”: This is the time it takes for the browser to have the “DOM” ready to be displayed, which is essentially the rendered HTML code without any images, custom fonts or styles. Note this is not the source code but the HTML rendered after all scripts have been executed.
- “Load”: This is the time it takes for HTML code AND all other resources to be loaded.
- “Finish”: This is the total time it takes for the browser to load all the resources on your page, plus any additional requests (e.g., analytics or marketing tracking scripts will fire up after the page rendering is complete).
Out of this set of data, the Load Indicator is the most important as this will show you the time it takes for your page to show something meaningful to the visitor. However, is this enough to evaluate your page speed?
Introducing the lighthouse
The “Load” figure might indicate how long it took your page to be loaded with formatted content and media, but these days, most website screens require scrolling to access all the content. This means the “Load” time covers everything that is rendered, whether it is visible or not, above the fold.
For example, if we look at the Zebedee website home page, this is the top screen, rendered to the visitor before any scrolling takes place:

But the “Load” time reported on the Network tool will reflect this and also all the other page sections, including pages about our case studies, our web design, marketing, and development services, some of the companies and organisations we have worked with and our latest blog posts – i.e all of the page, like this:
To have a clearer idea of the relative impact of all these elements on our page performance, we use tools like Google’s Page Speed Insights, based on the Lighthouse software which checks in-depth rendering indicators that go beyond what we can inspect on the Network report:
Just enter any page URL and a few seconds later, a comprehensive report is produced, showing how the requested URL behaves on mobile and desktop devices, with an overall performance score and specific metrics. This is affected by variations in network conditions for the connection between Google’s tool and the analysed URL, as well as the response of any other 3rd party resources being loaded. So, instead of using a single measure, it makes sense to be guided by the average of multiple readings. For example, these are the results for the BBC:
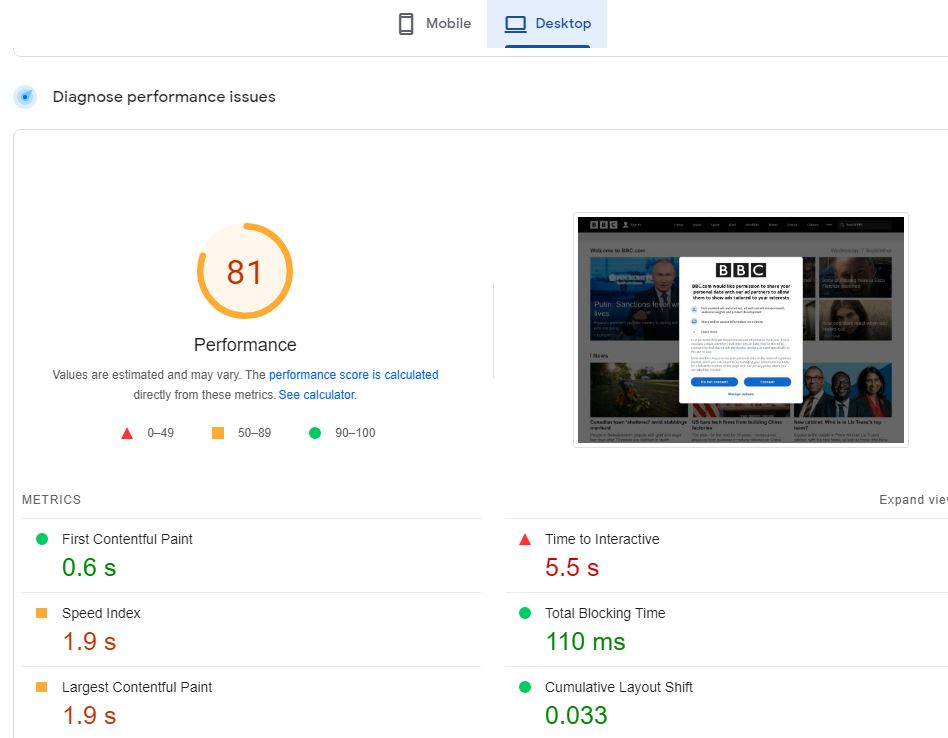
These indicators are reviewed in detail at Google’s support documentation, but in general they display a benchmark of page performance on mobile and desktop devices over six metrics, which are quite complex and would require a number of articles to explore in detail. In summary, the reports consist of the following:
- “First Contentful Paint (FCP)” which indicates when something appears on the screen, even partially.
- “Largest Contentful Paint (LCP)” which measures when the largest element is loaded, which effectively delays the overall page rendering.
- The “Speed Index” is a relative score for how quickly content is displayed visually.
- “Time to Interactive (TTI)” measures how long it takes the page to be ready for user interactions (so they can click on calls to action or scroll down).
- “Cumulative Layout Shift (CLS)” measures the number of changes in layout generated by the application of styles, before the screen is static enough for the user to interact with.
- “Total Blocking Time (TBT)” measures the delay between First Contentful Paint (FCP) and Time to Interactive (TTI), which will be perceived by your visitors as the time it takes for the page to be ready to be browsed.
All these metrics are analysed and compared with the averages achieved by top-performing websites, with an aggregate score showing how close the evaluated page is to the measuring standards. The goal here is to achieve a “green” score which signifies a good user experience in terms of performance.
Shifting Gears
Running a website involves a continuous process of updating and introducing features to respond to business needs and emerging challenges, as well as changes in consumer behaviour patterns. In a nutshell, a website must be constantly evolving to fulfil its purpose. However, as change is introduced, it affects the careful balance which was achieved when the site was originally launched and fully tested.
At Zebedee, our development life cycle brought in a number of changes which, whilst providing valuable functionality, appeared to have an adverse effect on our speed scores and therefore required effective action. This started with an in-depth review of the indicators from various reports and the suggestions that are presented on Google’s diagnostic screen.
Our approach was to be thorough and methodical, isolating each website component, to review how it contributed to specific metrics and the overall score. We tried loading a page with nothing but HTML code, then started adding styles, scripts, fonts, and media back until a clear picture emerged of their impact on page performance.
As well as measuring all the weight of the elements on the speed scores, we also investigated how the way they were loaded affected the end result. Different techniques were tested to ensure everything was incorporated with an optimal outcome.
Facing the Pitfalls
Web development is also a learning process, as technology is constantly changing, and implementation patterns must be adapted to meet these challenges. As a web design company, we also face the reality of a diverse device ecosystem, which sometimes requires an expanding testing process to ensure a consistent user experience can be provided and our clients’ brands are properly promoted.
During our internal page speed optimisation process, this involved making choices, as some of the features or 3rd party resources will add performance bottlenecks, for example:
- Fonts: Custom fonts help promote the brand in a distinctive way but where they are loaded from will impact the rendering time. Some fonts work best loaded as local resources, whilst some are more efficient for remote repositories.
- Forms: An embedded form on all pages might provide the convenience to generate a lead without having to go to a different URL. However, this will saddle the whole site with scripts for validation, submissions and bot filtering, which are usually required just once per visitor. Keeping the forms on specific URLs ensures the other pages can be optimised for their specific content.
- Tracking: Third-party tags like Google Analytics or Tag Manager will impact page speed depending on how quickly they are loaded – but also be aware of the instructions for implementation provided by their suppliers. Scripts loaded at the top of the page will affect the key indicators, so it’s advisable to move underneath the content to ensure indicators for initial page rendering are optimal.
- Caching: Server caching will benefit the overall response time as the initial code is provided faster but also consider a CDN and front-end asset caching to prevent server response fluctuations from affecting the score. A quick glance at the impact can be seen on these screenshots: before caching, all elements must be loaded form the server, which adds to loading time and bandwidth required. After caching, the data transfer is dramatically reduced and the server loading time is minimal.
Full Speed Ahead
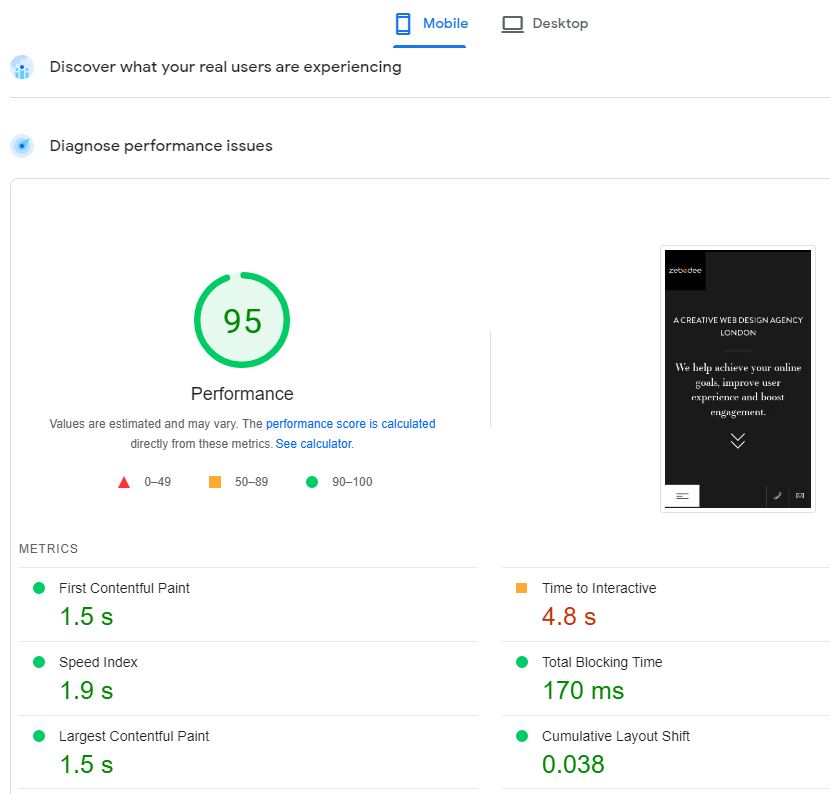
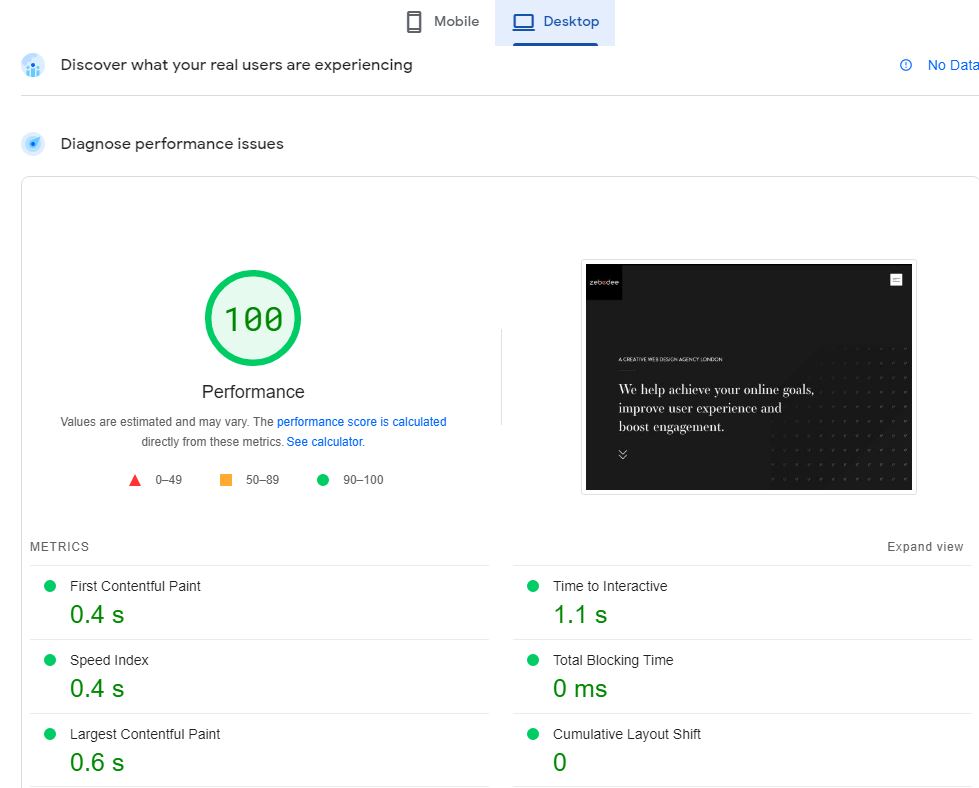
After completing this exercise, we observed a significant reduction in page load times and increased efficiency in the way local and third-party resources were used, which resulted in a major increase in our overall Google PageSpeed score, with a consistent reporting of over 90 (green) for most of our pages on both mobile and desktop diagnostics.
Our SEO reporting clearly shows time spent on the site has increased and our target keyword positioning went up. And we are sure we can do the same for you so why don’t you get in touch?